You are here
Local transport processes at clean and contaminated Taylor Flows
SPP1506 experimental data repository
Sven Kastens, Christoph Meyer, Marko Hofmman, Michael Schlüter
Institute of Multiphase Flows, Hamburg University of Technology, Eissendorfer Str. 38, 21073 Hamburg
www.ims-tuhh.de
Content
- Pressure driven Taylor Flows in a small D=2x2mm channel (Eo<4)
- Recirculation in slug between Taylor bubbles
- Velocity field at the rear of clean and contaminated Taylor bubbles
- Single Taylor bubbles in vertical channels (Eo>4)
- Rise Velocity of Taylor bubbles in various channels
- Circular Cross Section: D=5.5, 6, 7, 8mm
- Comparison Circular & Square Cross Section: D=6mm vs. D=6x6mm
- Comparison Clean vs. Contaminated (Triton C=10mmol/m3)
- Local Velocity Fields at Taylor bubbles
- Mass Transfer of Taylor bubbles in various channels
- Modelling of Mass Transfer Process of Taylor Bubbles: Sh vs. Eo
Pressure driven Taylor Flows in a small D=2x2mm channel (Eo<4)
During the first period of the SPP1506, the investigation of sequential gas/liquid Taylor Flows were in the focus of the numerical and experimental groups. For the detailed validation of experiments and numerical simulations, a Taylor Flow scenario was defined [Mey14].
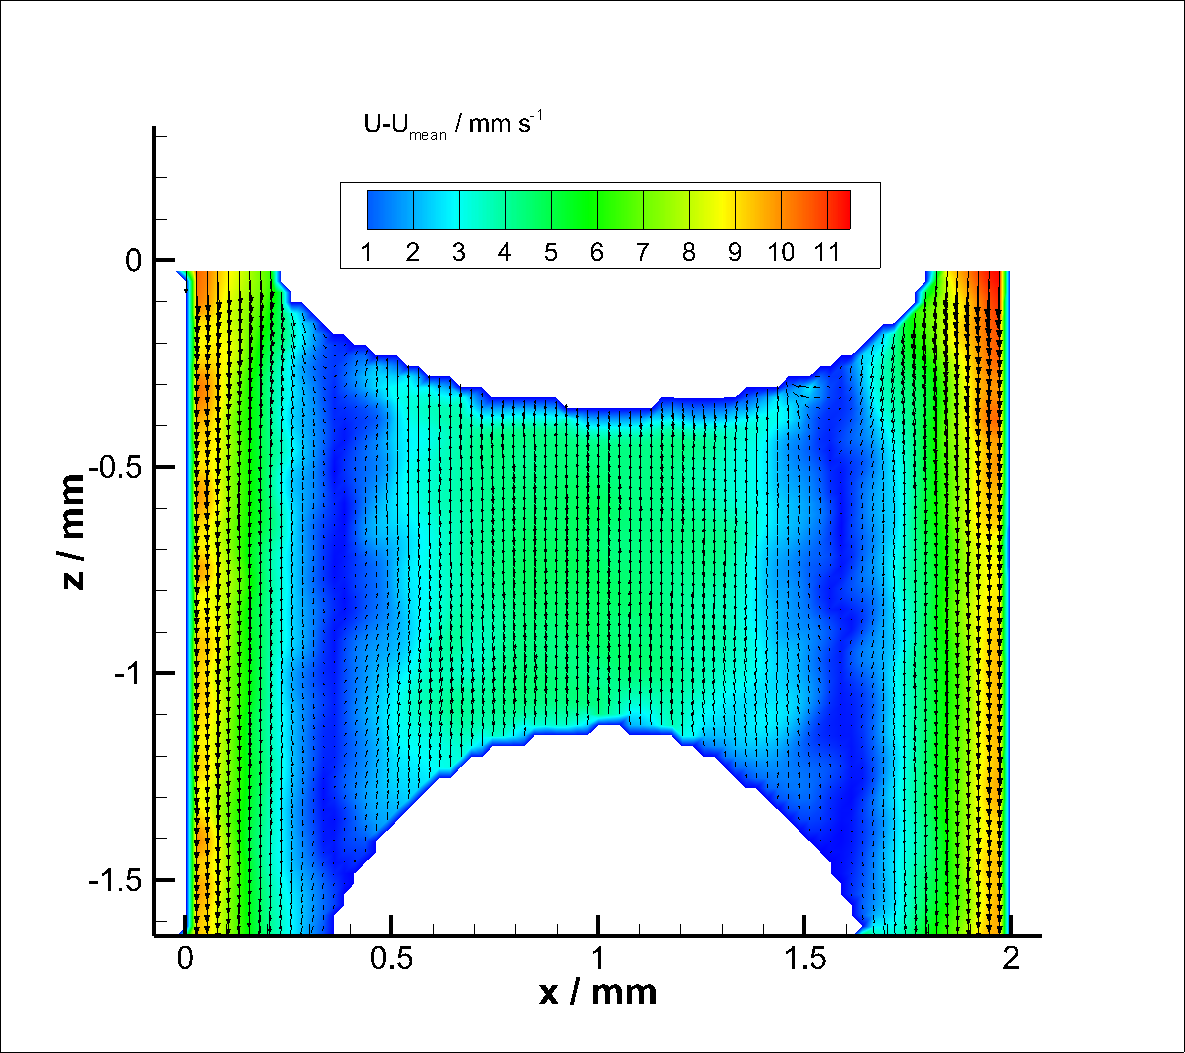
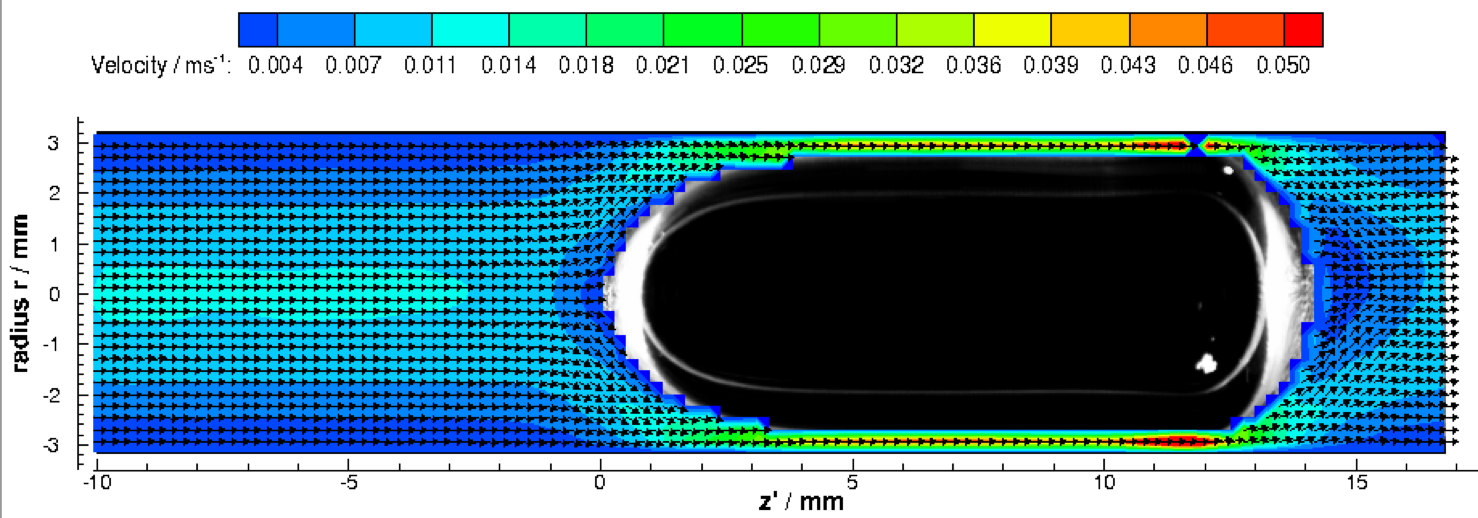
Recirculation in slug between Taylor bubbles
Download recirculation-vel.dat
Download recirculation-slug.lpk
Velocity field of recirculation flow between two Taylor bubbles in the center of the channel shows strong similarities with the numerical results[Mey14][Ala13].
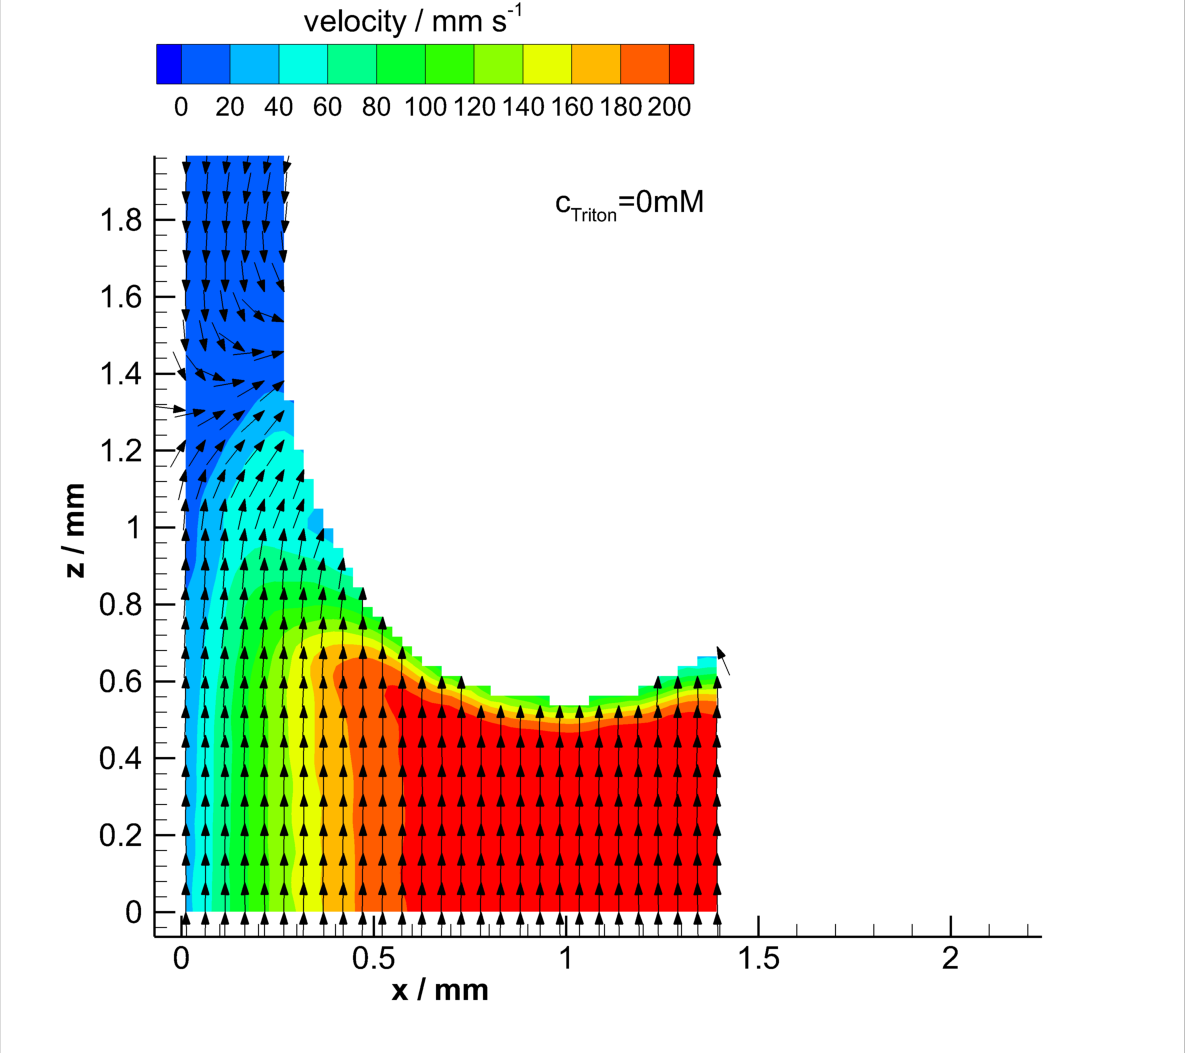
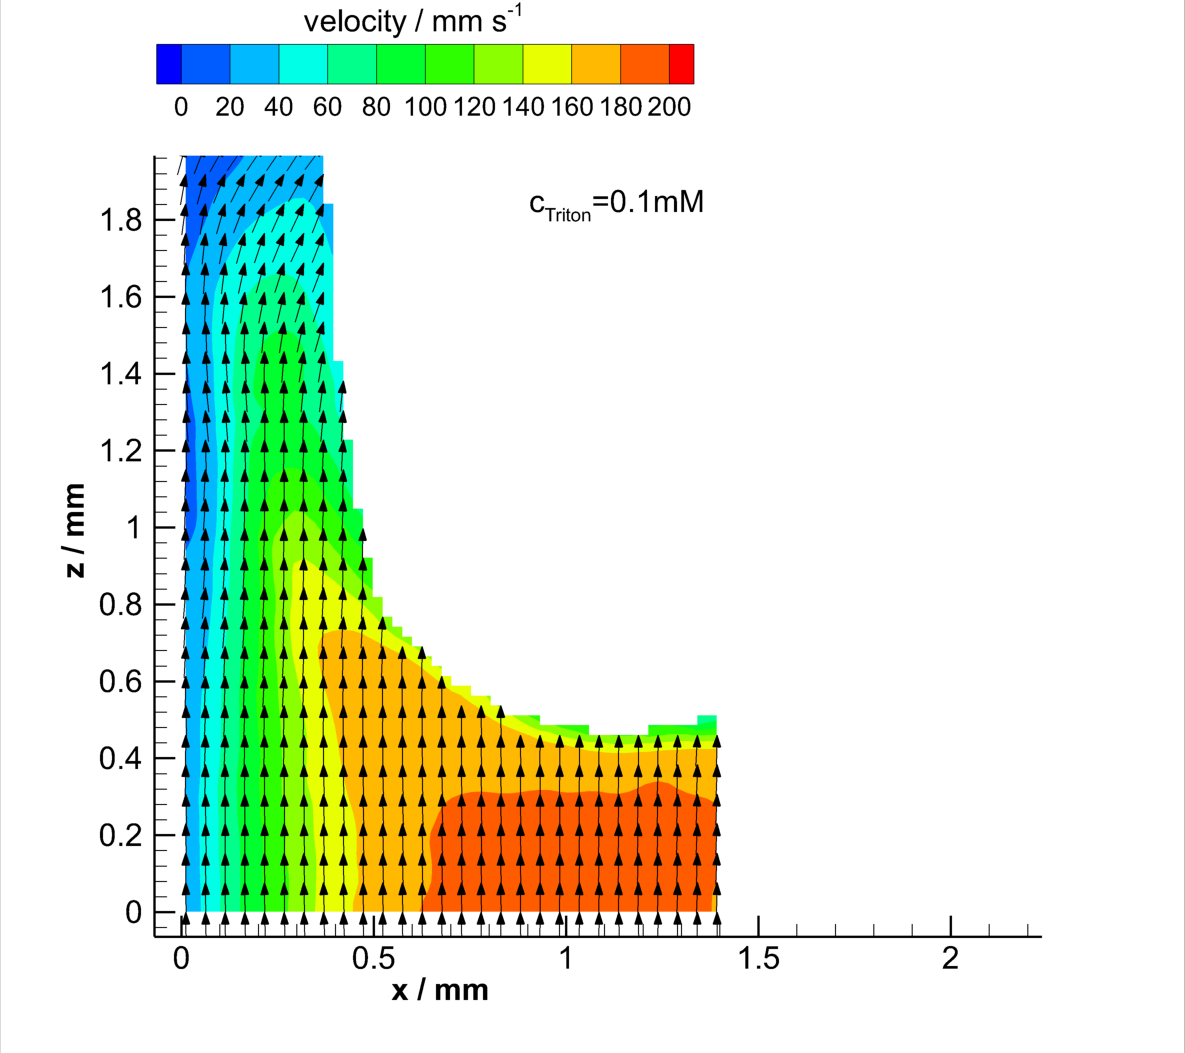
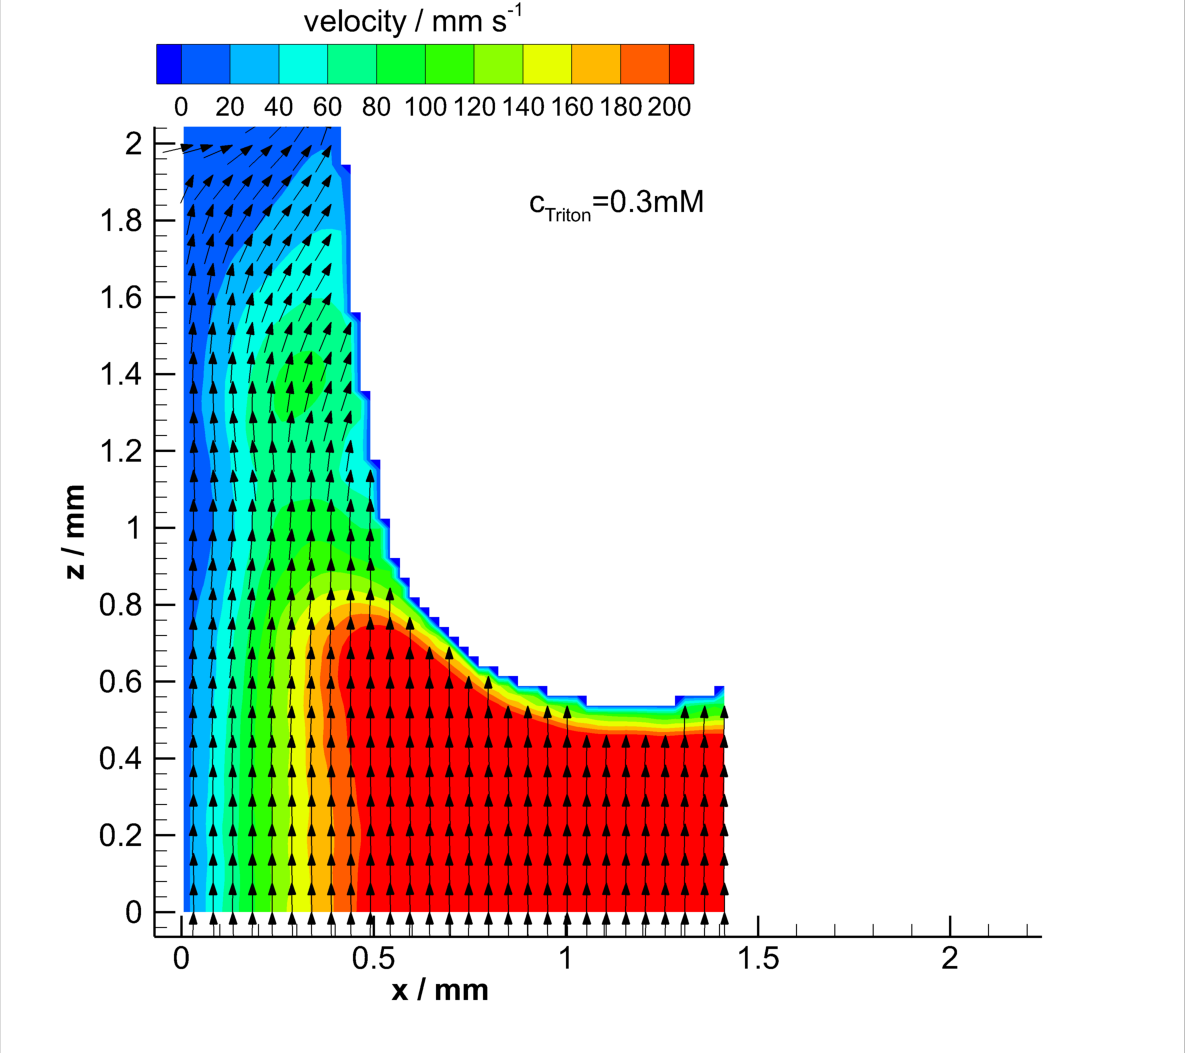
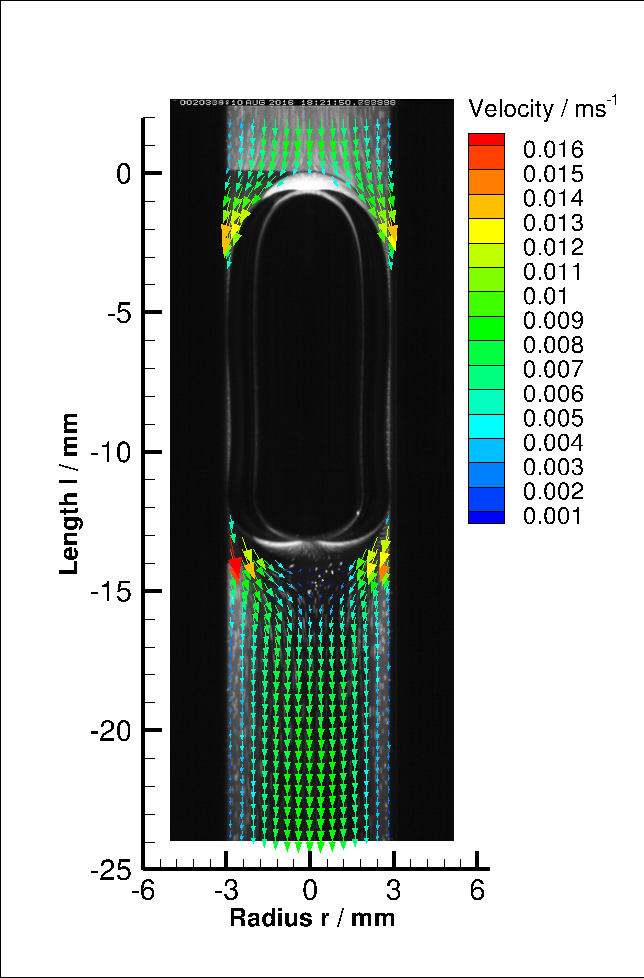
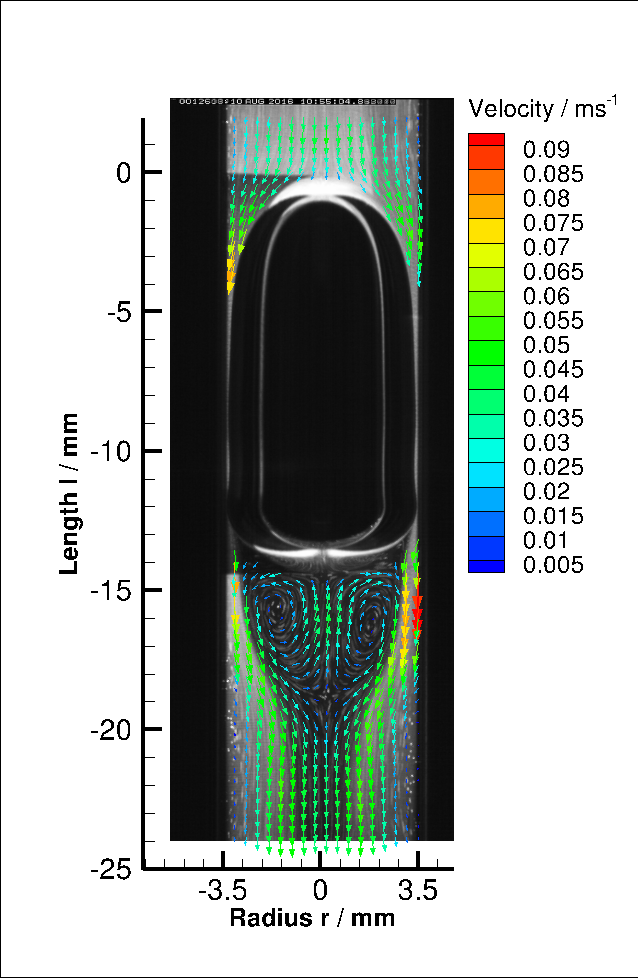
Velocity field at the rear of clean and contaminated Taylor bubbles
Download bubble-rear_Triton0.0mM.dat
Download bubble-rear_Triton0.1mM.dat
Download bubble-rear_Triton0.3mM.dat
Download bubble-rear_comparison.lpk
It is known, that surface active agents can form layers at interfaces depending on the bulk concentration, ad- and desorption coefficients and the shear force by the local liquid flow. For the investigation of the effect of surfactants on the mobility of the interface of Taylor flows, a non-ionic surfactant Triton X-100 was used. Differences in the local flow field in the liquid film were identified. Additionally, the reduced surface tension of the system, leads to shape changes of the Taylor bubbles. Although, significant differences in the clean and the contaminated cases are shown. Due to immobilization of the gas/liquid interface by the accumulation of Triton X-100 at the bubble rear, the local fluid velocity changes [Kas17b].
Single Taylor bubbles in various channels (Eo>4)
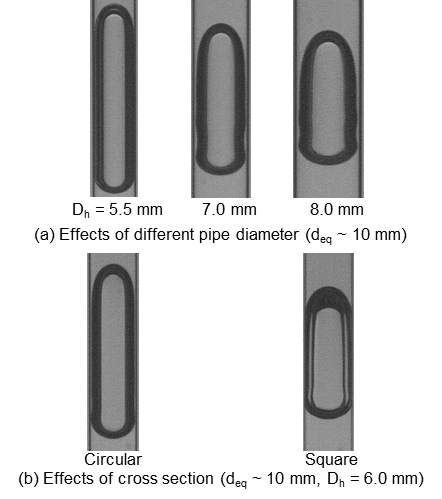
FIG.2.1.1 Taylor bubbles images in different channels
Taylor bubbles are rising in vertical channels, when their buoyancy force is dominating the interfacial forces, which is described with the Eötvös number of the system. In water systems the critical Eötvös number leads to a critical channel Diameter of about D=5.1mm. Therefore, Taylor bubbles in channels 5.5mm
Rise Velocity of Taylor bubbles in various channels
The rise velocity of Taylor bubbles in vertical channels is independent of the Taylor bubble volume or sphere volume equivalent bubble diameter deq but strongly depending on the channel diameter D, which can be seen in Fig2.1.1. The influence of the cross sectional geometry is significant for fluid systems with relative small Eötvös numbers Eo<10. In chapter 2.1.3: The rise behavior of Taylor bubbles in channels with square cross section is compared within circular cross section. Because the fluid film in the channel edges is larger than in circular channel cross sections, the fluid can pass the Taylor bubble much faster, which leads to a higher rise velocity. [Kas15]
Circular Cross Section: D=5.5, 6, 7, 8mm
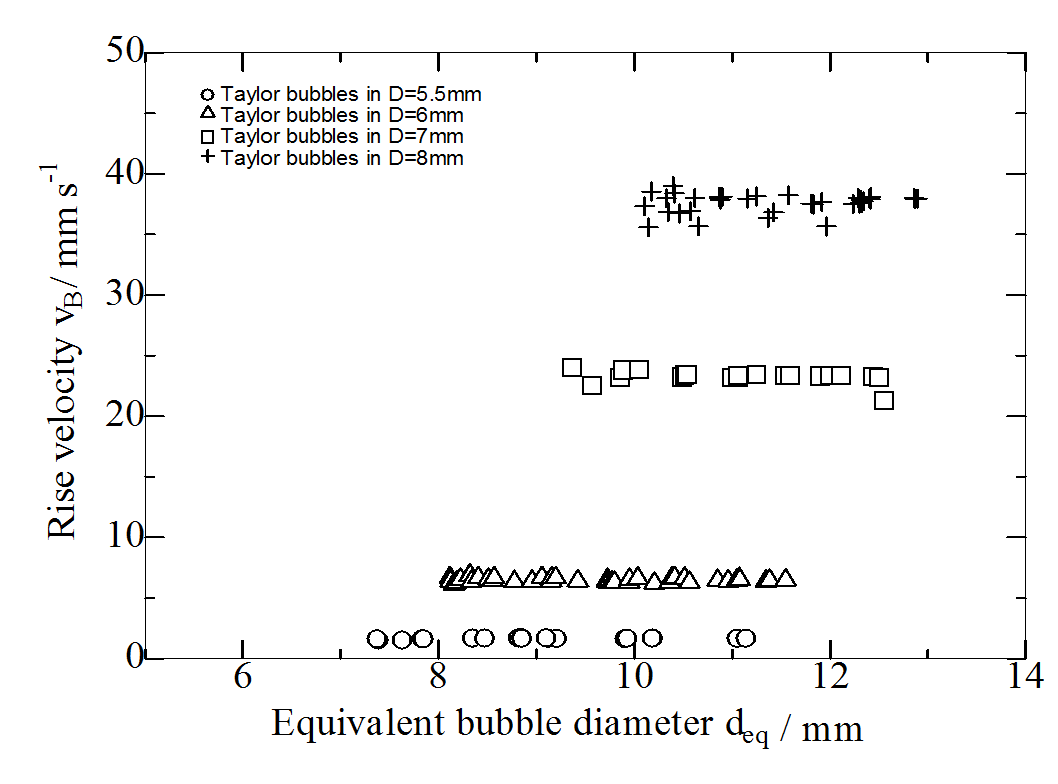
The rise velocity of Taylor bubbles (4<Eo<10) is independent of the equivalent bubble diameter deq but strongly affected by the channel diameter D (Fig.1.2).[Kas15]
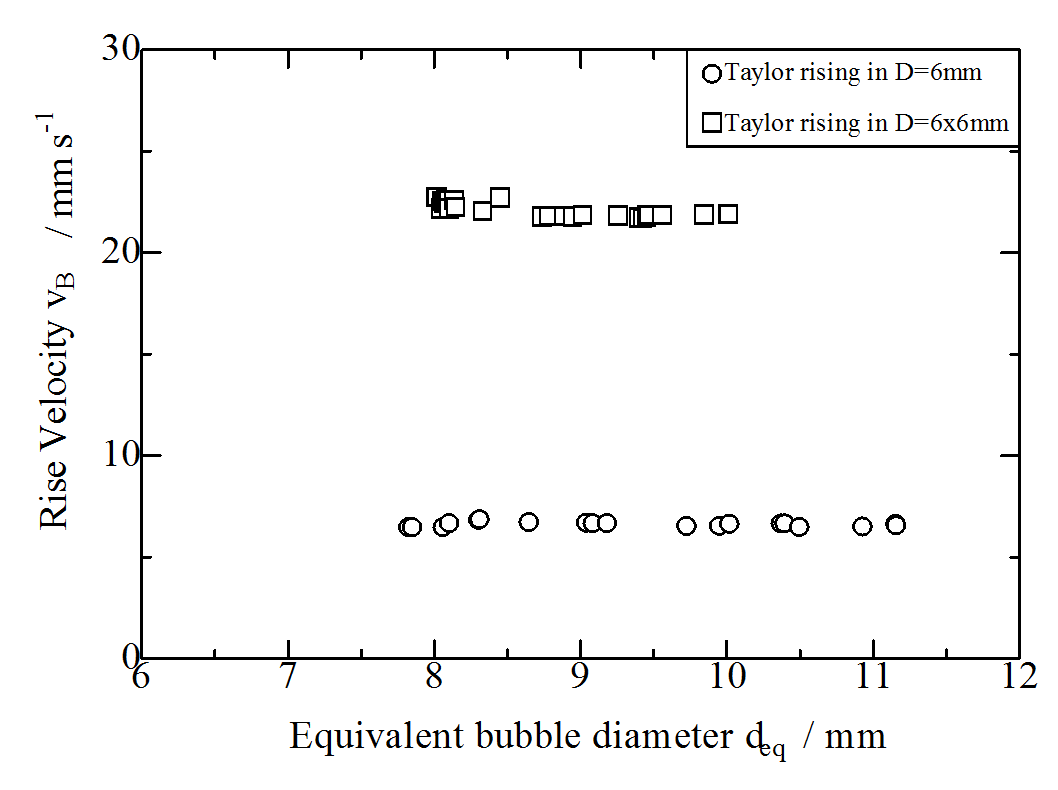
Comparison Circular & Square Cross Section: D=6mm vs. D=6x6mm
Download D6square-vs-circular.txt
The rise velocity of Taylor bubbles in D=6x6mm channel is more than three times faster than for Taylor bubbles rising circular cross section with the same hydraulic diameter (Dh=6mm).[Kas15]
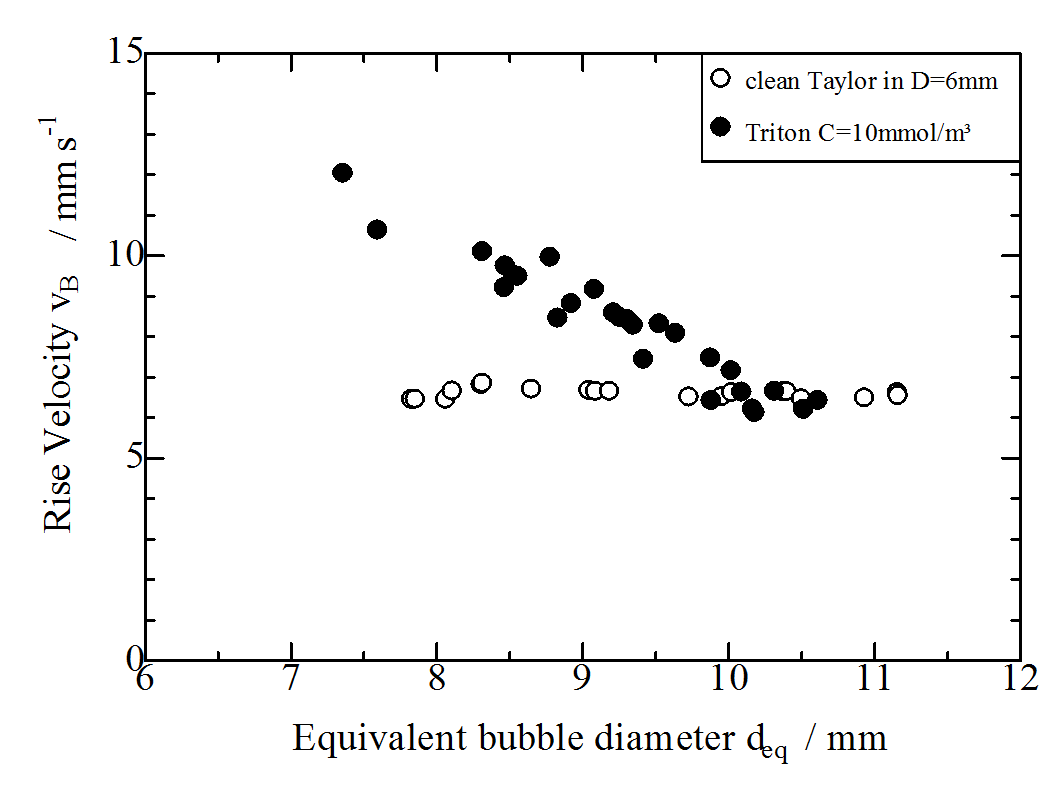
Comparison Clean vs. Contaminated (Triton C=10mmol/m³)
Download D6VB_clean-vs-triton.txt
The bubble shape and the minimal liquid film thickness influences the rise velocity of bubbles in channels. For Taylor bubbles in clean systems this minimal film thickness is not changing anymore, where the rise velocity is independent of the bubble volume (compare Chapter 2.1.2). Surfactants reduce the interfacial tension, which affects the bubble shape and the mobility of the interface. Usually free rising bubbles have a reduced rise velocity due to the immobilization of the interface. Taylor bubbles with low Eötvös numbers show another trend, because the shape and minimal film thickness is dominant. In Fig 2.1.4 it is shown, that the contaminated Taylor bubbles (Triton X-100 C=10mmol /m³)are rising faster than the clean Taylor bubbles.
Local Velocity Fields at single Taylor bubbles
Taylor Bubble Wake Structures: D= 6, 7, 8mm
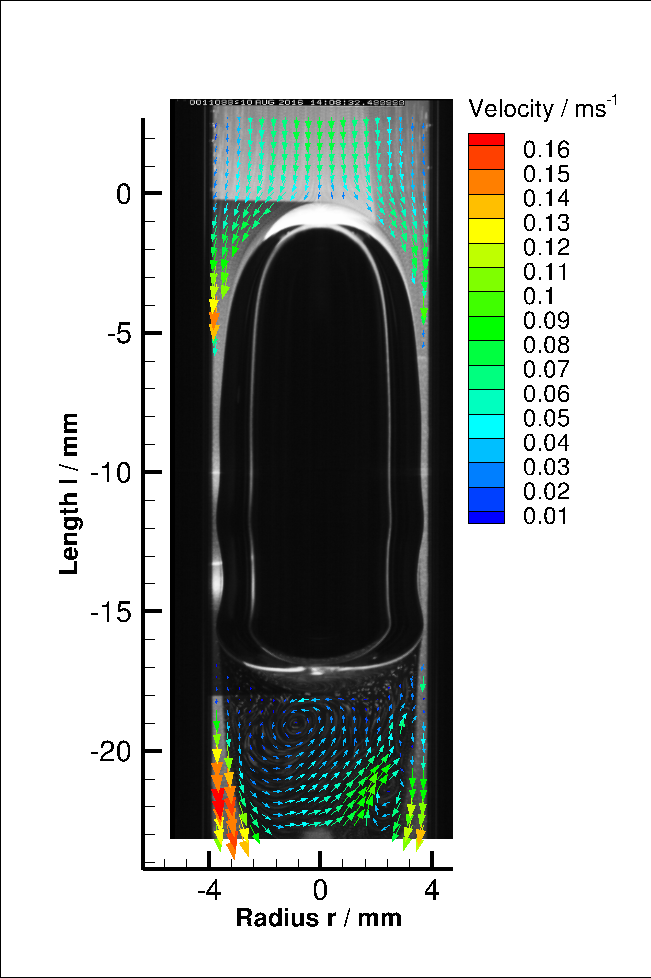
Significant wake structures behind Taylor bubbles in D= 6, 7 & 8mm have been identified (laminar, toroidal, turbulent)[Kas17a].
Download D6_vector.dat
Download D7_vector.plt
Download D8_vector.dat
D=6mm; Clean vs. Contaminated (Triton C=10mmol/m³)
Download D6_CC_vel_clean.dat
Download D6_CC_vel_triton.dat
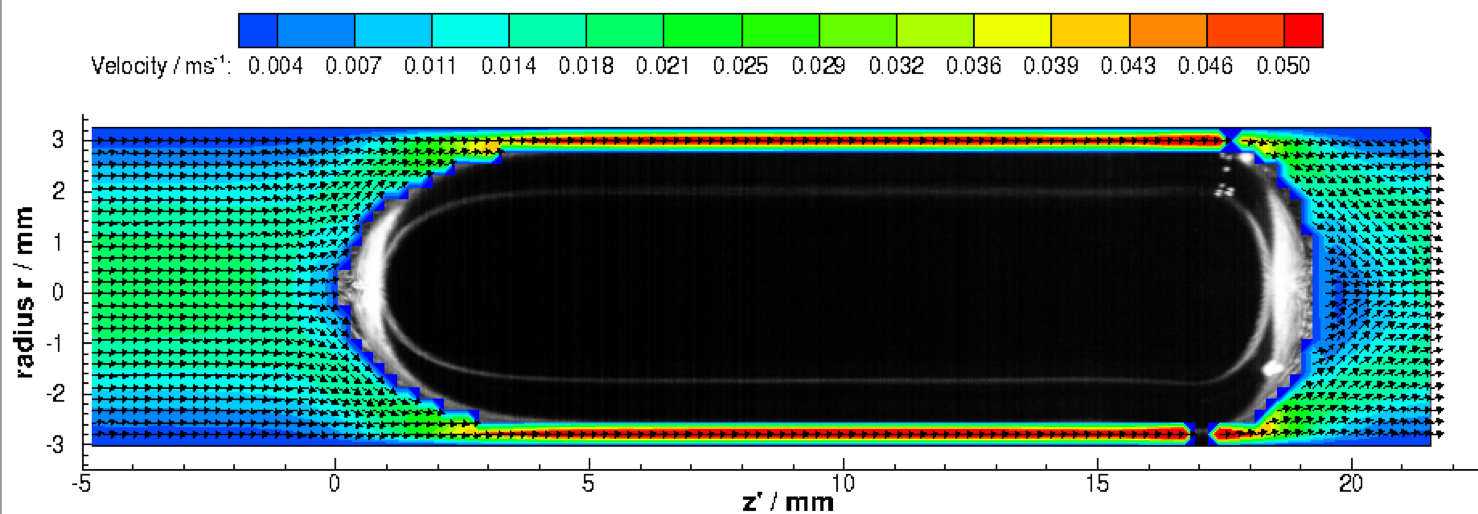
The rise velocity of Taylor bubbles in contaminated flow (Triton C=10mmol/m³) is higher than for clean system (see chapter 2.1.3). The velocity field infront of Taylor bubbles “fixed” in counter current flow, are showing a stronger parabolic inflow [Kas17b]
Mass Transfer of Taylor bubbles in various channels
The Mass Transfer Coefficient kL is also independent of the equivalent bubble diameter deq, where each data point represents the coefficient kL for a single Taylor bubble with the deq and these are NOT several data points for a large dissolving bubble [Kas15].
Circular Cross Section: D=5.5, 6, 7, 8mm
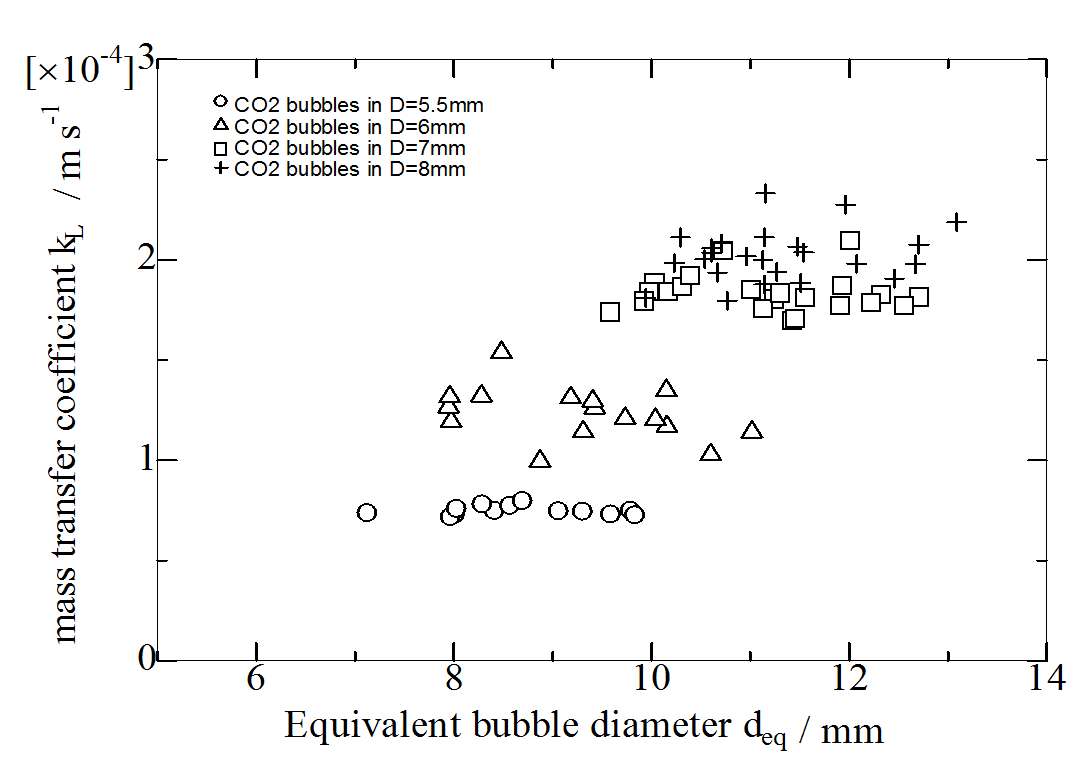
The Mass Transfer Coefficient kL is also independent of the equivalent bubble diameter deq but strongly depending on the channel diameter D [Kas15].
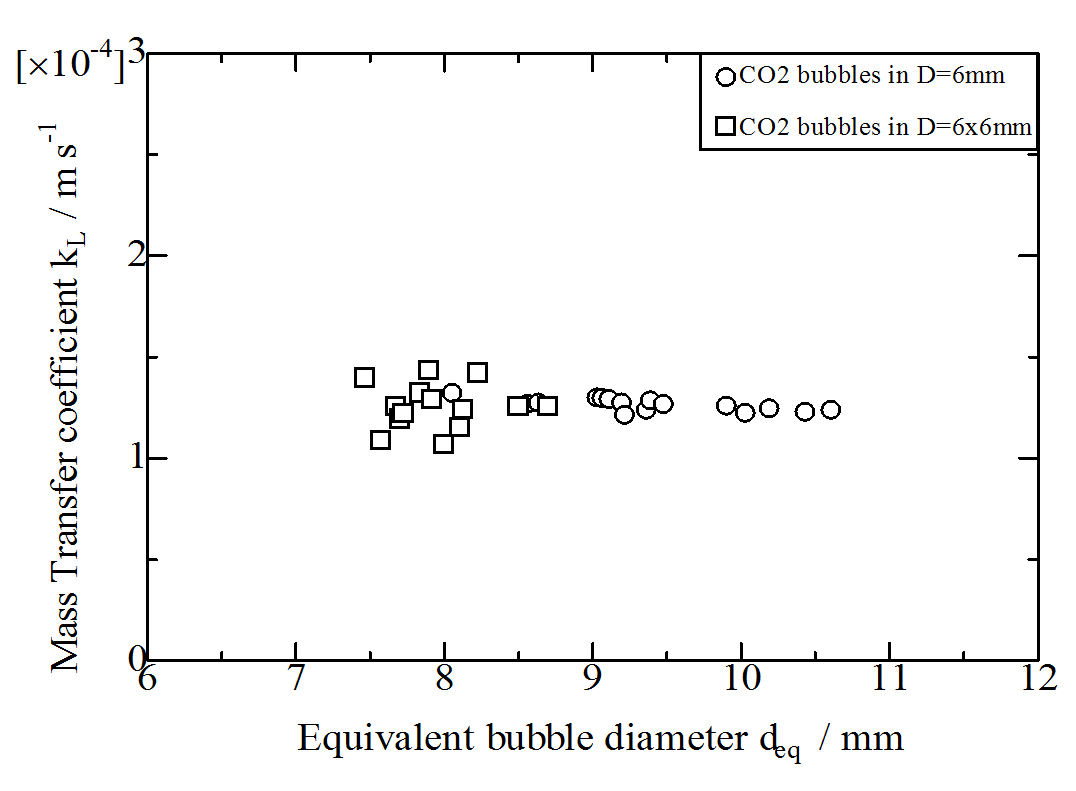
Square Cross Section: D=6x6
Download kLD6-square-vs-circular.txt
Even if the Taylor bubbles in square cross sections are rising much faster than the Taylor bubbles in circular cross sections (compare Fig.1.3), the mass transfer coefficient kL shows the same values for Dh=6mm[Kas15].
Modelling of Mass Transfer Process of Taylor Bubbles: Sh vs. Eo.
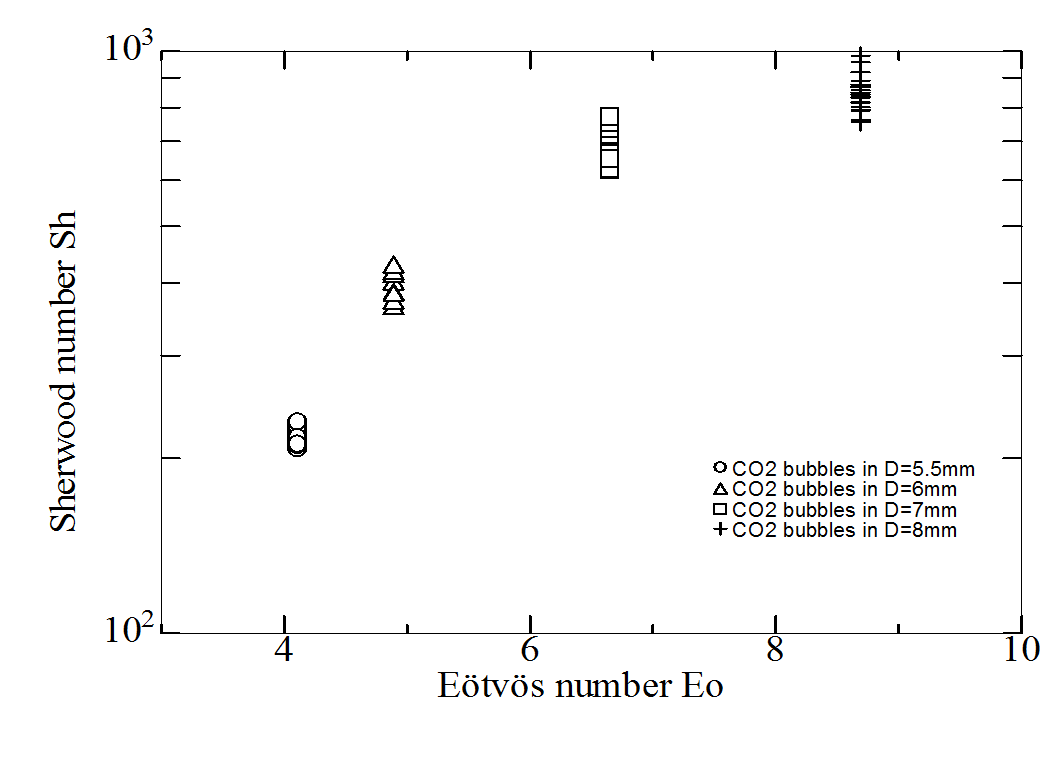
In Figure 2.4.1 the data of Sherwood number vs. Etövös number is shown for CO2 Taylor bubbles in channels 5.5mm < D < 8mm from Kastens et al. 2015, where in the publication the comparison with Sh for Taylor Bubbles in channels 12.5mm < D < 25mm was made and an empirical Sh-correlation Sh=f(Eo) was established together with the Research group of Prof. Akio Tomiyama from Kobe University[Kas15].
References
[Kas17b] Kastens, S.; Meyer, C.; Hoffmann, M.; Schlüter, M.: Experimental Investigation and Modelling of Local Mass Transfer Rates in Pure and Contaminated Taylor Flows, in Transport Processes at Fluidic Interfaces (ISBN 978-3-319-56602-3), Bothe, D.; Reusken, A. (Eds.), Advances in Mathematical Fluid Mechanics, 2017, DOI: 10.1007/978-3-319-56602-3_21
[Kas17a] Kastens, S.; Timmermann, J.; Strassl, F.; Rampmaier, R. F.; Hoffmann, A.; Herres-Pawlis, S.; Schlüter, M.: Test system for the investigation of reactive Taylor bubbles. Chem. Eng. Tech., 2017, 40(8), pp. 1494-1501, DOI: 10.1002/ceat.201700047
[Fal15] Falconi, C. J.; Lehrenfeld, C.; Marschall, H.; Meyer, C.; Abiev, R.; Bothe, D; Reusken, A.; Schlüter, M.; Wörner, M.: Numerical and experimental analysis of local flow phenomena in laminar Taylor flow in a square mini-channel, Physics of Fluids, 2016, 28, 012109-1 - 012109-23, DOI: 10.1063/1.4939498
[Kas15] Kastens, S.; Hosoda, S.; Schlüter, M.; Tomiyama, A.: Mass Transfer from Single Taylor Bubbles in Mini Channels, Chemical Engineering & Technology, 2015, 38(11), special Issue: "Multiscale Multiphase Process Engineering" (Editorial: Schlüter, M.; Bothe, D.; Terasaka, K.), pp. 1925-1932, DOI: 10.1002/ceat.201500065
[Mey14] Meyer, C.; Hoffmann, M.; Schlüter, M.: Micro-PIV analysis of gas-liquid Taylor flow in a vertical oriented square shaped fluidic channel, International Journal of Multiphase Flow, 2014, 67, pp. 140-148, DOI: 10.1016/j.ijmultiphaseflow.2014.07.004.
[Ala13] Aland, S.; Lehrenfeld, C.; Marschall, H.; Meyer, C.; Weller, S: Accuracy of two-phase flow simulations: The Taylor Flow benchmark, PAMM-Proceedings in Applied Mathematics and Mechanics, 2013, 13(1), pp. 595 – 598, DOI: 10.1002/pamm.201310278