You are here
Taylor bubble shape data
SPP1506 experimental data repository
Stephan Bodena, Mohammad Haghnegahdara, Uwe Hampela,b
aInstitute of Fluid Dynamics, Helmholtz-Zentrum Dresden - Rossendorf, Bautzner Landstr. 400, 01328 Dresden, Germany
bAREVA Endowed Chair of Imaging Techniques in Energy and Process Engineering, Technische Universität Dresden, 01062 Dresden, Germany
Contents
X-ray radiography and computed tomography were used to measure the interface morphology of a Taylor bubble under varying conditions.
- Circular channel, Dh = 2.0 mm
- Square channel, Dh = 2.0 mm
- Circular channel, Dh = 6.0 mm
- Taylor bubble interface profile
- Taylor bubble interface profile in contaminated fluid
- Taylor bubble interface profile in surfactant contaminated fluid at varying surfactant concentration
- Square channel, Dh = 6.0 mm
Circular channel, Dh = 2.0 mm
Taylor bubble interface profile
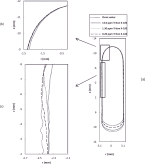
A gas Taylor bubble (air) was moving upwards co-currently with the flow of liquid (aqueous solution of 76.9% glycerol) in a vertically aligned circular glas channel with hydraulic diameter of Dh = 1.98 mm. Synchrotron X-ray high-speed high-resolution radiography was used to measure the two-dimensional (2D) projected interface of the rising Taylor bubble. A detailed description of the experiment as well as the physical parameters are given by Aland et al. (2013).
Taylor bubble interface profile at varying bubble velocity
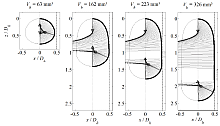
Gas Taylor bubbles (air) were moving upwards at varying speeds co-currently with the flow of liquid (aqueous solution of 76.9% glycerol) in a vertically aligned circular glas channel with hydraulic diameter of Dh = 1.98 mm. Synchrotron X-ray high-speed high-resolution radiography was used to measure the two-dimensional (2D) projected interface of the rising Taylor bubbles. A detailed description of the experiment as well as the physical parameters are given by Boden et al. (2017) and Aland et al. (2013).
Only the Taylor bubble front tip shapes are given.
Square channel, Dh = 2.0 mm
Taylor bubble interface profile
A gas Taylor bubble (air) was moving upwards co-currently with the flow of liquid (aqueous solution of 76.9% glycerol) in a vertically aligned square glas channel with hydraulic diameter of Dh = 1.98 mm. Synchrotron X-ray high-speed high-resolution radiography was used to measure the two-dimensional (2D) projected lateral interface of the rising Taylor bubble. A limited angle computed tomography approach was used to measure the averaged three-dimensional (3D) interface of an ensemble of rising gas Taylor bubbles at the same experimental conditions. A detailed description of the experiment as well as the physical parameters are given by Marschall et al. (2014) and Boden et al. (2014).
Taylor bubble interface profile at varying bubble velocity
Gas Taylor bubbles (air) were moving upwards at varying speeds co-currently with the flow of liquid (aqueous solution of 76.9% glycerol) in a vertically aligned square glas channel with hydraulic diameter of Dh = 1.98 mm. Synchrotron X-ray high-speed high-resolution radiography was used to measure the two-dimensional (2D) projected lateral interface of the rising Taylor bubble. A detailed description of the experiment as well as the physical parameters are given by Boden et al. (2017) and Marschall et al. (2014).
Only the Taylor bubble front tip shapes are given.
Circular channel, Dh = 6.0 mm
Taylor bubble interface profile
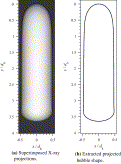
Single gas Taylor bubbles (air) of different size at fixed vertical position in counter-current flow of liquid (clean water) in a vertically aligned circular glas channel with hydraulic diameter of Dh = 6 mm. Microfocus X-ray radiography was used to measure the two-dimensional (2D) projected interface of the Taylor bubbles. A detailed description of the experiment as well as the physical parameters are given by Boden et al. (2017) and Haghnegahdar et al. (2016a).
Taylor bubble interface profile in surfactant contaminated fluid
Single gas Taylor bubbles (air) of different size at fixed vertical position in counter-current flow of liquid (water, clean and contaminated) in a vertically aligned circular glas channel with hydraulic diameter of Dh = 6 mm. Microfocus X-ray radiography was used to measure the two-dimensional (2D) projected interface of the Taylor bubbles. A detailed description of the experiment as well as the physical parameters are given by Haghnegahdar et al. (2016c).
The size of the bubbles in clean water and in contaminated water are not identical, however comparable.
For each dataset are available:
- Averaged radiographic image of the gas taylor bubble (Radiography)
- Image horizontal axis pixel coordinates (X-Axis)
- Image vertical axis pixel coordinates (Z-Axis)
- Measured Taylor bubble 2D projected interface (Interface)
The liquid was contaminated with surfactant Triton X-100 at a concentration of 13.0 ppm.
 |
|
||||||||
 |
|
||||||||
 |
|
||||||||
 |
|
||||||||
Taylor bubble interface profile in surfactant contaminated fluid at varying surfactant concentration
Single gas Taylor bubbles (air) of different size at fixed vertical position in counter-currently flow of liquid (water, clean and contaminated) in a vertically aligned circular glas channel with hydraulic diameter of Dh = 6 mm. Microfocus X-ray radiography was used to measure the two-dimensional (2D) projected interface of the Taylor bubbles. A detailed description of the experiment as well as the physical parameters are given by Haghnegahdar et al. (2016c).
The size of the bubbles are not identical, however comparable.
For each dataset are available:
- Averaged radiographic image of the gas taylor bubble (Radiography)
- Image horizontal axis pixel coordinates (X-Axis)
- Image vertical axis pixel coordinates (Z-Axis)
- Measured Taylor bubble 2D projected interface (Interface)
 |
|
||||||||||||||||
Square channel, Dh = 6.0 mm
Taylor bubble interface profile (3D)
Single gas Taylor bubbles (air) of different size at fixed vertical position in counter-currently flow of liquid (clean water) in a vertically aligned square glas channel with hydraulic diameter of Dh = 6 mm. Microfocus X-ray tomography was used to measure the three-dimensional (3D) interface of the Taylor bubbles. A detailed description of the experiment as well as the physical parameters are given by Boden et al. (2016) and Haghnegahdar et al. (2016b).
Notes
- All interfaces are given as point clouds.
- All given coordinates are normalized with respect to the hydraulic diameter Dh.
- The plane spanned by the x- and y-axis (horizontal plane) is aligned orthogonally to the vector of gravity,
the positive vertical z-axis is aligned in parallel to the vector of gravity.
References
Aland, S., Boden, S., Hahn, A., Klingbeil, F., Weismann, M., Weller, S.:
Quantitative comparison of Taylor flow simulations based on sharp-interface and diffuse-interface models.
International Journal for Numerical Methods in Fluids 73 (2013), 344-361.
doi:10.1002/fld.3802
Boden, S., dos Santos Rolo, T., Baumbach, T., Hampel, U.:
Synchrotron radiation microtomography of Taylor bubbles in capillary two-phase flow.
Experiments in Fluids 55 (2014), 1768.
doi:10.1007/s00348-014-1768-7
Boden, S., Haghnegahdar, M., Hampel, U.:
Measurement of Taylor bubble shape in square channel by microfocus X-ray computed tomography for investigation of mass transfer.
Flow Measurement and Instrumentation (2016, accepted manuscript).
doi:10.1016/j.flowmeasinst.2016.06.004
Boden, S., Haghnegahdar, M., Hampel, U.:
X-ray microtomography of Taylor bubbles with mass transfer and surfactants in capillary two-phase flow.
In: Bothe, D., Reusken, A. (eds.): Transport processes at fluidic interfaces (Series: Advances in Mathematical Fluid Mechanics), Springer, Cham (2017, manuscript submitted).
Haghnegahdar, M., Boden, S., Hampel, U.:
Investigation of mass transfer in milli-channels using high-resolution microfocus X-ray imaging.
International Journal of Heat and Mass Transfer 93 (2016a), 653-664.
doi:10.1016/j.ijheatmasstransfer.2015.10.033
Haghnegahdar, M., Boden, S., Hampel, U.:
Mass transfer measurement in a square milli-channel and comparison with results from a circular channel.
International Journal of Heat and Mass Transfer 101 (2016b), 251-260.
doi:10.1016/j.ijheatmasstransfer.2016.05.014
Haghnegahdar, M., Boden, S., Hampel, U.:
Investigation of surfactant effect on the bubble shape and mass transfer in a milli-channel using high-resolution microfocus X-ray imaing.
International Journal of Multiphase Flow (2016c), 184-196.
doi:10.1016/j.ijmultiphaseflow.2016.09.010
Marschall, H., Boden, S., Lehrenfeld, C., Falconi D., C.J., Hampel, U., Reusken, A., Woerner, M., Bothe, D.:
Validation of interface capturing and tracking techniques with different surface tension treatments against a Taylor bubble benchmark problem.
Computers & Fluids 102 (2014), 336-352.
doi:10.1016/j.compfluid.2014.06.030
Last update: 09.11.2016, Stephan Boden


